Figure 5.
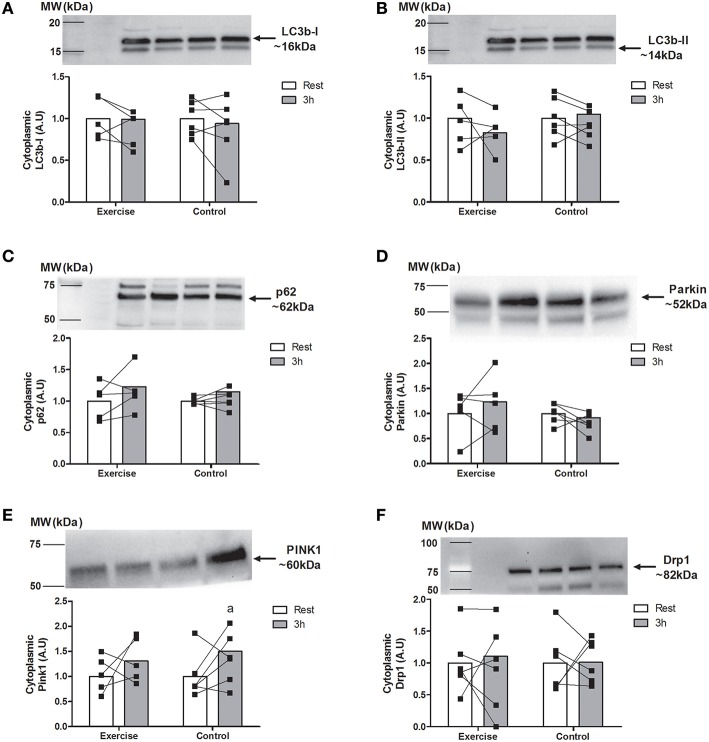
Cytoplasmic and mitochondrial levels of markers of basal autophagy, autophagy, and mitophagy proteins at rest and 3 h following endurance exercise (60 min cycling ~70% VO2peak) LC3b-I (A; n = 5 EX; n = 6 CON), LC3b-II (B; n = 5 EX; n = 6 CON), p62 (C; n = 5 EX; n = 6 CON), Parkin (D; n = 5 EX; n = 6 CON), PINK1 (E; n = 5 EX; n = 6 CON), and DRP1 (F; n = 6 EX; n = 6 CON). All values are expressed relative to stain free gel and presented in arbitrary (means ± SD) with statistical significance established when P < 0.05. Different vs. arest within condition.

