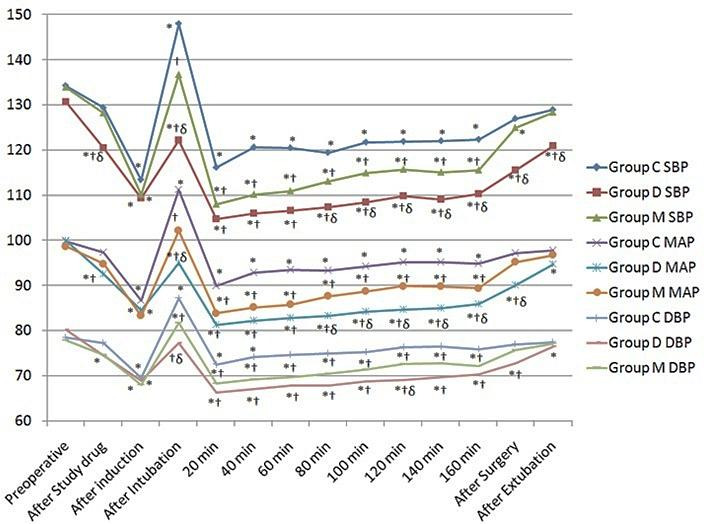
Figure 3.

Changes in the blood pressure (SBP, DBP and MAP) observed in the three groups during the study period. *P˂0.05 within group (vs baseline value), † P < 0.05 compared with group C, δ P < 0.05 group D vs group M.

Changes in the blood pressure (SBP, DBP and MAP) observed in the three groups during the study period. *P˂0.05 within group (vs baseline value), † P < 0.05 compared with group C, δ P < 0.05 group D vs group M.