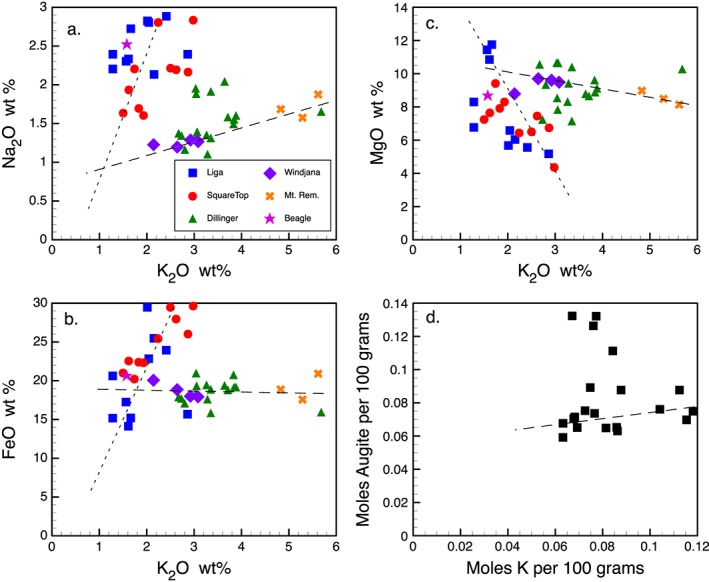
Figure 7.

Element abundances in rocks of the Kimberley area, from ChemCam analyses (data from NASA PDS). Note that most rocks of the Dillinger member (including Windjana) and the Mount Remarkable member plot near a line on each graph and that most of the other rocks (Liga, Square_Top, Beagle) fall near a second line. This suggests mixing of three sediment components: one potassic, K2O > 5.6%, FeO(tot) ≈ 18%, MgO < 8%; one sodic, Na2O > 3%, K2O > 2.5%, FeO(tot) > 30%, MgO < 4%; and one mafic, Na2O ≈ 1.5%; K2O ≈ 1.5%, FeO(tot) ≈ 18%, MgO ≈ 12%. ChemCam analyses sorted by stratigraphic members: Liga (targets Liga, Yulleroo, Petaluma Elvire, McSherrys, Matheson, Maddox, Harms, Glidden, Nullara); Square_Top (targets Square_Top, Square_Top2, Egan, Elgee, Hooper, Roebuck, TopSquare_Top, McHale, Esaw); Dillinger (targets Corrara, Forster, Fargoo, Wallal, Jarrad, Cow_Bore, Kevin's_Dam, Thangoo, Blinker_Hill, Paperbark, Pentecost, Mondoomoa, Lodestone, Tumagee, Yarrada, Dillinger); Windjana (targets Windjana_DRT; minidrill_tail; maindrill_tail; hole_RMI); Mt. Remarkable (targets Mahoney, Mahoney_2, San_Sou); and Beagle (target Beagle). (a)_ Sodium and potassium. Four points from the Dillinger member fall above the general correlation line for Dillinger (and Windjana) and could represent mixtures of the potassic and sodic sediment sources. (b) Iron and potassium abundances. (c) Magnesium and potassium. (d) Molar abundances of K and Ca available to form augite, based on ChemCam analyses [R. Wiens, personal communication]. K is in moles per 100 g of rock, Ca to form augite is moles Ca per 100 g rock, minus the moles Ca required to consume all Al in forming plagioclase: Caaugite = Catot – ½(Altot − Natot − Ktot). Most data fall on a rough line containing the Windjana analyses and the most K‐rich analyses (Dillinger, San_Sou). The four points with high Caaugite and moderate K are the same in Figure 4a that contain Na above its correlation line; this extra Na translates here to higher Caaugite.
