
Figure 8.
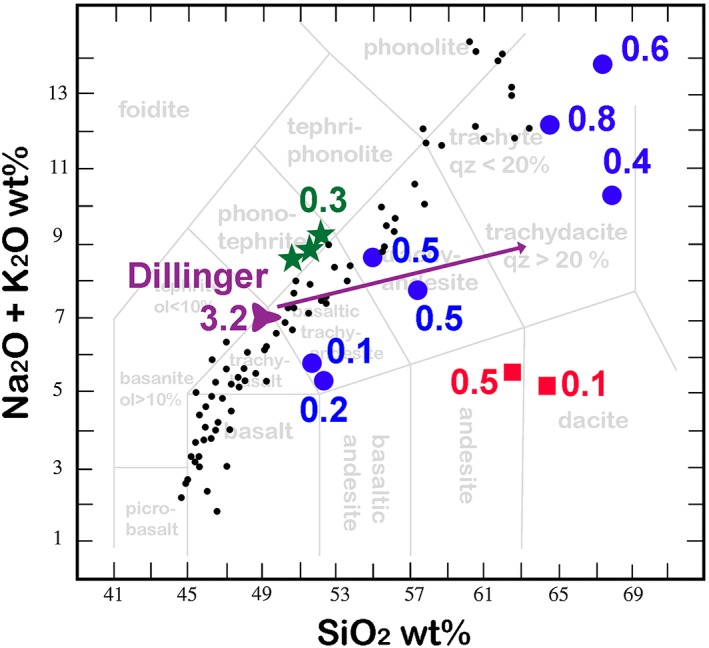
TAS diagram (total alkalis‐silica) diagram of igneous rock classification [Le Maitre et al., 2002], showing the Dillinger sample in relation to other igneous rocks of Earth and Gale Crater. The K‐rich sediment component in the Windjana sample, here represented by an average of ChemCam LIBS analyses of the Dillinger and Mount Remarkable members, is the purple trillium; subtraction of Fe‐O‐(H) cement from the analysis (see text) would move the composition along the purple arrow toward a trachyte composition. Other igneous rocks identified and analyzed by LIBS include “dioritic” samples in red squares and alkaline rocks in blue circles [Sautter et al., 2015]. The Jake Matijevic rock, a mugearite, is shown as green stars [Stolper et al., 2013]. For comparison, the black dots show lava compositions from the ocean island of St. Helena [Kawabata et al., 2011], a typical igneous trend consistent with fractionation of olivine (SiO2 ~ 40%, K2O + Na2O = 0). The number near each symbol (same color as the symbol) is K2O/Na2O for that analysis; the Gale Crater igneous samples span a wide range of K2O/Na2O, with the Dillinger analysis being the highest of all. For comparison, all of the St. Helena samples (despite their range in SiO2 contents) have K2O/Na2O near 2.5.