Figure 1.

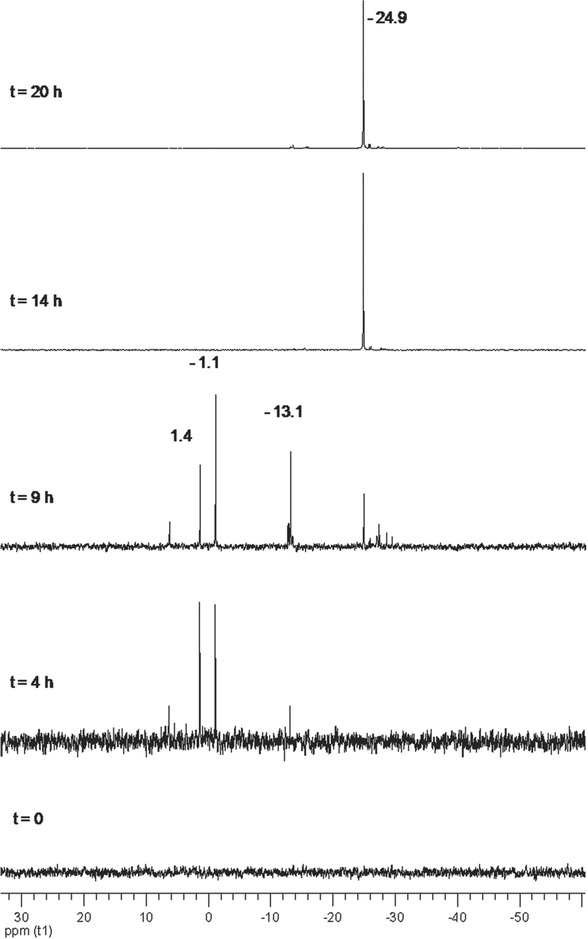
31P{1H} NMR (DMSO‐d6, T = 25 °C, 121.49 MHz) of Test A. The vertical scale of the spectra taken at t = 4 h and t = 9 h is emphasized in order to show the signals due to first degradation products.

31P{1H} NMR (DMSO‐d6, T = 25 °C, 121.49 MHz) of Test A. The vertical scale of the spectra taken at t = 4 h and t = 9 h is emphasized in order to show the signals due to first degradation products.