Figure 8.

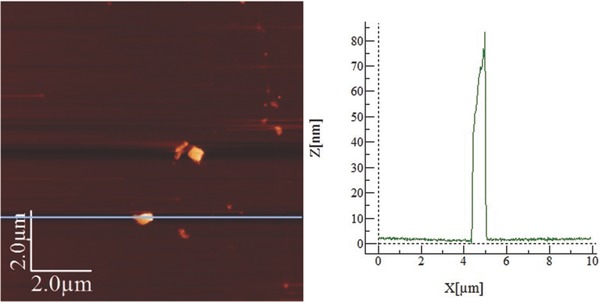
Left: AFM image from drop‐cast BP flakes of a sample with P/H2O molar ratio equal to 0.7, scale bar = 2.0 μm. Right: height profile map.

Left: AFM image from drop‐cast BP flakes of a sample with P/H2O molar ratio equal to 0.7, scale bar = 2.0 μm. Right: height profile map.