
Figure 4. Silencing Egr1 reduces the growth of glioma and colorectal cancer cell lines.
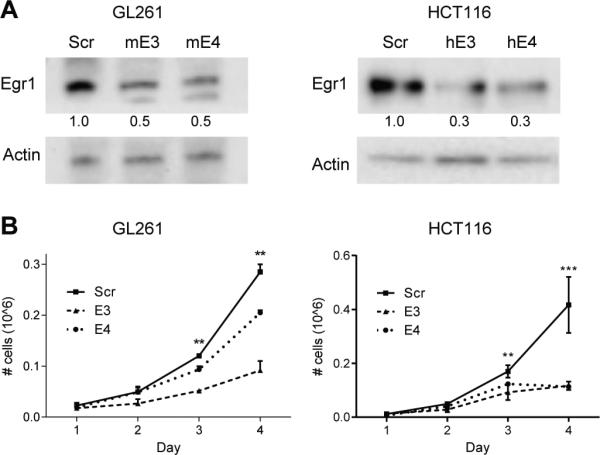
(A) GL261 glioma and HCT116 colorectal cells were infected with lentiviruses expressing scrambled or two Egr1-specific shRNAs (GL261: mE3, mE4; HCT116: hE3, hE4). Cellular proteins were immunoblotted using antibodies to Egr1 and Actin (loading control). Densitometry values represent the ratio of Egr1 to Actin normalized to the Scr control. (B) Growth curves show the average numbers of viable cells on each day. **p<0.005, ***p<0.001.