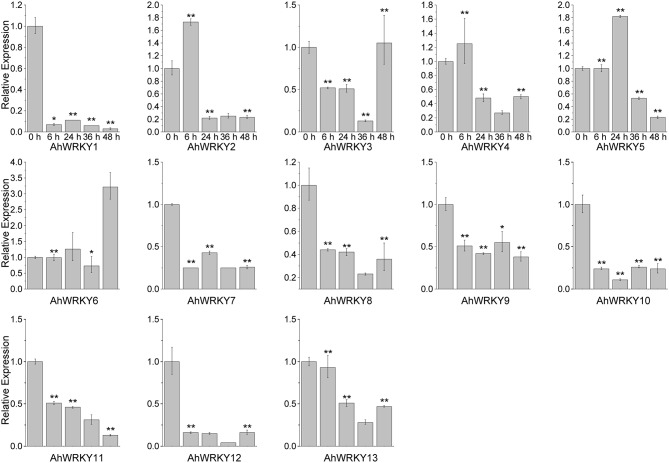
Figure 4.
The expression pattern of AhWRKY genes after SA treatment. The Y-axis indicates the relative expression level; X-axis (0, 6, 24, 36, and 48 h) indicated hours of SA treatment. The standard errors are plotted using vertical lines. * and ** mean significant difference at P < 0.05 and P < 0.01, respectively.

