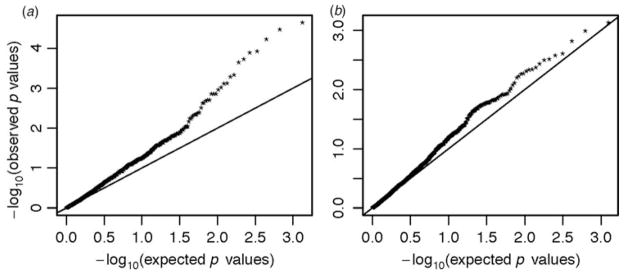
Fig. 1.
Quantile–quantile (QQ) plot of the genome-wide association studies signals enrichment among the miRNA expression quantitative trait loci in schizophrenia (SZ) and bipolar disorder (BD). The expected −log10 p values under the null hypothesis are represented on the x axis, while the observed values are represented on the y axis. (a) Shows the enrichment for SZ single nucleotide polymorphisms (SNPs) and (b) for BD SNPs.

