
Figure 5.
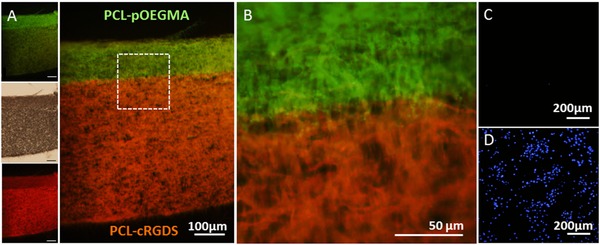
Dual functionality scaffolds demonstrated by fluorescent labelling of functionalities and cell adhesion. Fluorescence microscopy images of cross sections of bi‐functional scaffolds formed with opposing PCL‐Ini and PCL‐cRGDS surfaces. Post‐processing polymerization was used to produce a PCL‐p(OEGMA‐co‐biotin) surface. A,B) Overlaid fluorescence images of histological cross‐sections labelled with fluorescein‐streptavidin (green) on the p(OEGMA‐co‐biotin) and with Cy5 (red) for the PCL‐cRGDS showing well defined spatial resolution. Insets (left) show the brightfield and single channel fluorescence images with 100 μm scale bars. C,D) Bovine tenocytes were seeded on fresh scaffolds and cultured for 7 d before being stained with DAPI (blue) for cell nuclei and imaged with fluorescent microscopy. The PCL‐pOEGMA surface is shown in the upper image (C) and the opposing PCL‐cRGDS surface is shown in the lower image (D).