. 2016 Feb 9;7(5):3414–3426. doi: 10.1039/c5sc04818d

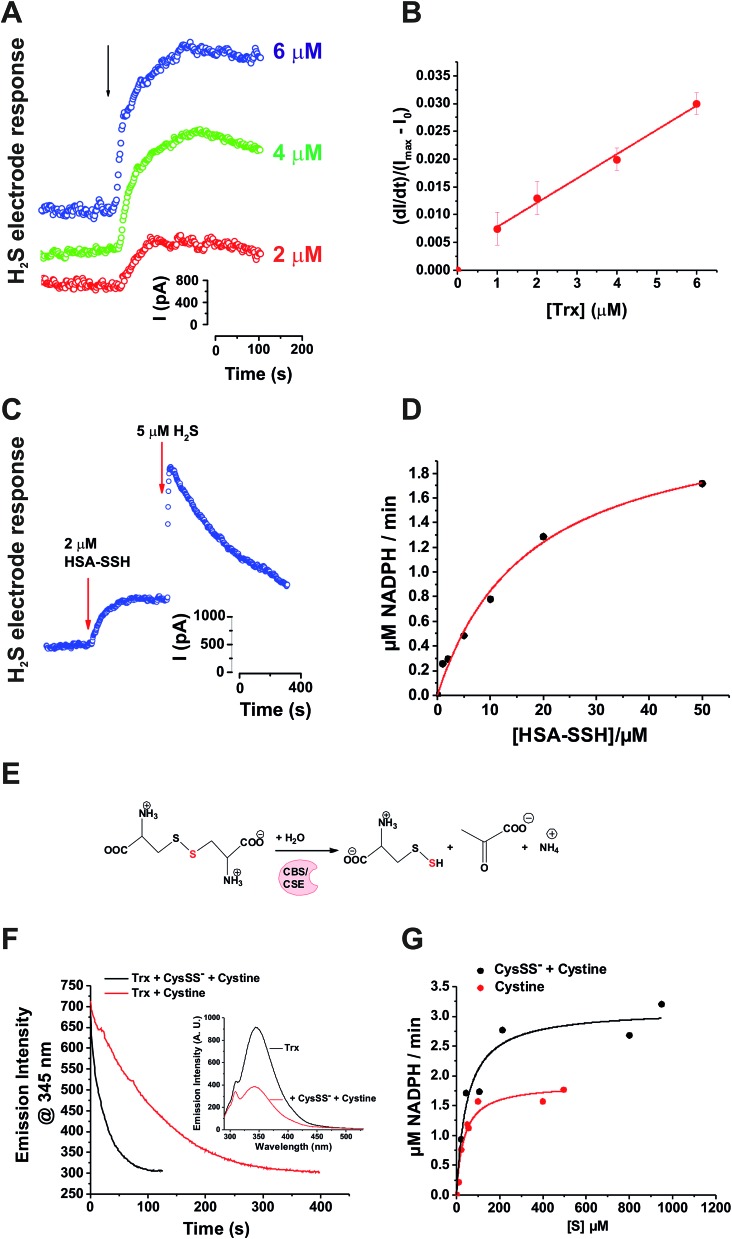
Fig. 2. Trx system cleaves cysteine and protein persulfides to form H2S. (A) H2S release from 20 μM HSA-SSH upon addition of different concentrations of Trx (E. coli), measured amperometrically by the H2S sensitive electrode. (B) Plot of the initial rates vs. the concentration of Trx. (C) Combined with TrxR (rat) and NAPDH, Trx (human) efficiently release all sulfur trapped in HSA-SSH as H2S. Na2S was injected as internal standard for the comparison. (D) Kinetic analysis of the reaction was performed by measuring the rates of NADPH oxidation varying the concentration of HSA-SSH and keeping the concentrations of other parameters constant: 1 μM Trx (human), 0.01 μM TrxR (rat) and 250 μM NADPH. Experiments were performed in triplicates. (E) Schematic overview of the reaction used for the generation of the CysSS/CysSSCys mixture. (F) Kinetics of Trx (E. coli) oxidation (1 μM) with 10 μM CysSSCys (black line) or CysSS/CysSSCys mixture (red line), followed by tryptophan fluorescence (λex 280 nm) changes. Inset: Emission spectra before and after the reaction of 1 μM Trx with 50 μM CysSS/CysSSCys mixture. See Fig. S5 in ESI. (G) Kinetic analysis of the reaction of CysSSCys (black line) or CysSS/CysSSCys mixture (red line) with 1 μM Trx (human), 0.01 μM TrxR (rat) and 250 μM NADPH.

Fig. 2