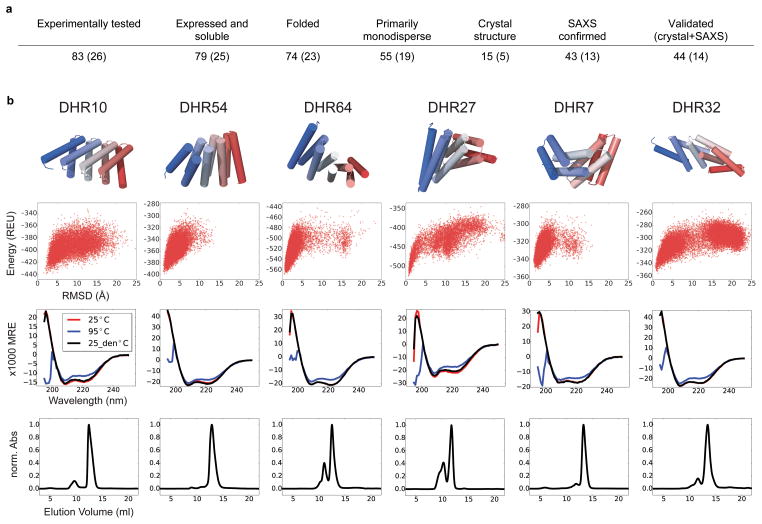
Figure 3. Characterization of designed repeat proteins.
a, Design success rate. Values for subset with disulfide bonds are in parentheses. b, results on six representative designs. Top row: design models. Second row: computed energy landscapes. Energy is on y axis (REU, Rosetta energy unit) and RMSD from design model on x axis. All six landscapes are strongly funneled into the designed energy minimum. Third row: CD spectra collected at 25°C (red), 95°C (blue) and back to 25°C (black). The proteins do not denature within this temperature range (MRE, mean residue elipticity; deg•cm2•dmol−1•residue−1). Bottom row: SEC elution profile directly after affinity chromatography purification. The designs are mostly monodisperse. The maximum absorbance at 280 nm was normalized to 1.

