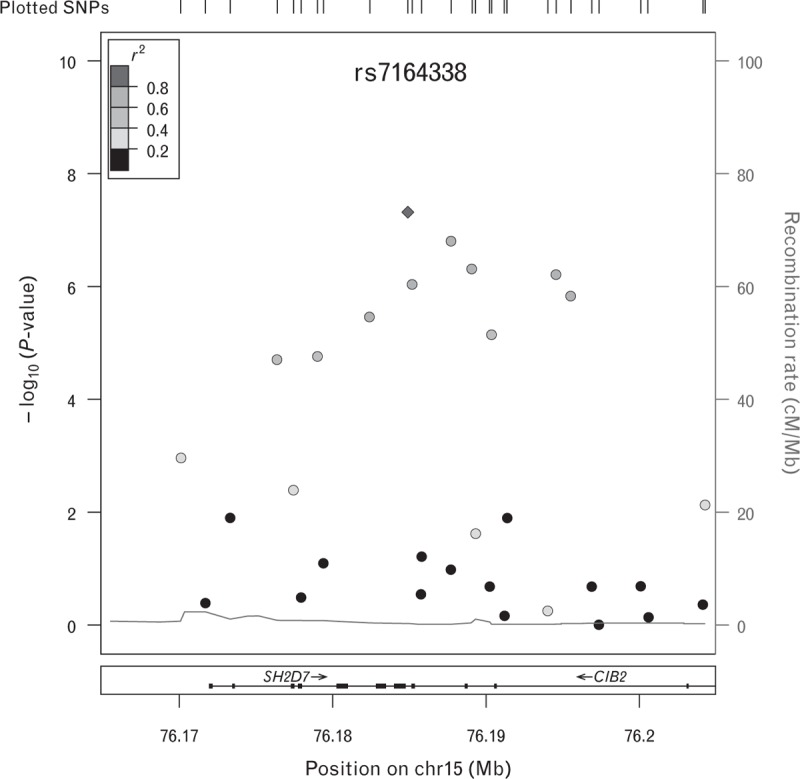
FIGURE 2.

Regional plot of CIB2 locus. Observed P values (−log10) are plotted against base-pair position. The lead SNP (rs7164338) is represented as a purple diamond and the linkage disequilibrium relationship (r2) with other SNPs in the region are indicated by the colour of the circles. Blue peaks represent recombination rates (HapMap 2), and the RefSeq genes are provided at the bottom. CIB2, calcium and integrin-binding protein-2; SNP, single-nucleotide polymorphism.
