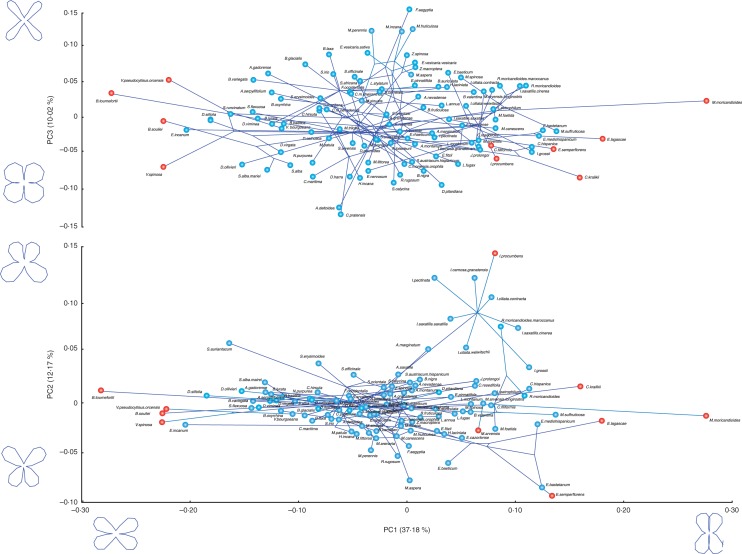
Fig. 2.
Phylomorphospace of the first three PC axes showing the relationship between the phylogeny and corolla shapes for the Brassicaceae taxa included in this study. Indicated in red is the position in the shape space of the ten species receiving the highest values of corolla shape partial static disparity.

