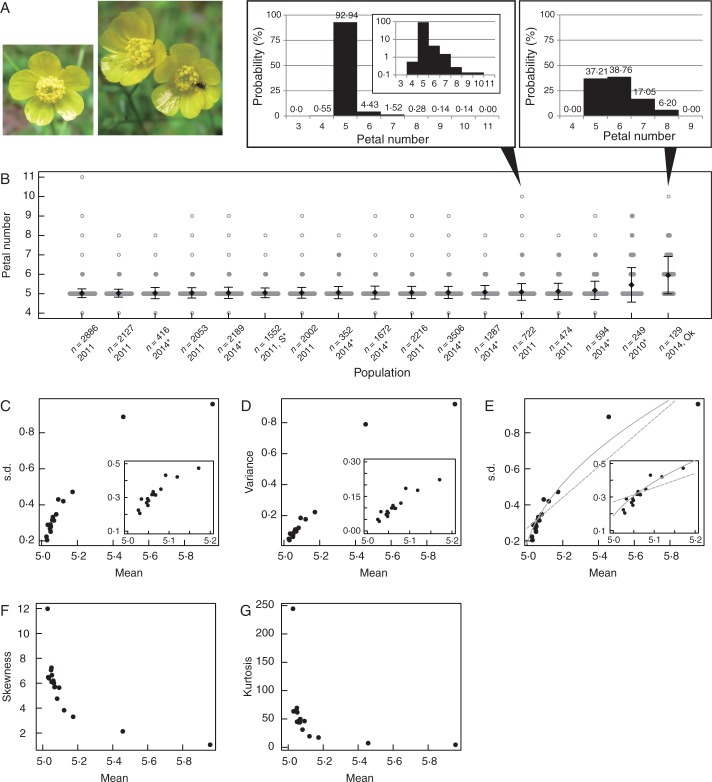
Fig. 1.
Intraspecific variation of petal number in Ranunculus japonicus (Ranunculaceae). (A) Typical flower of R. japonicus with five petals (left) and two flowers of an individual plant with six and seven petals, respectively (right). The histograms indicate the probability of each petal number in the two populations. (B) The variation in petal numbers of R. japonicus measured in different years and locations in Japan, including nine published measurements marked by asterisks (*; Kitazawa and Fujimoto, 2014). The populations are ordered by the means denoted by solid diamonds. The sample size and year for each measurement are represented as the x-axis label. All populations were distributed in Osaka prefecture except for two populations measured in Shiga (S) and Okayama (Ok) prefectures. The width of the grey bars indicates the probability of each petal number in each population. Open circles indicate non-zero probabilities of less than 1 %. (C, D) The relationship between the mean and s.d. (C) or variance (D). (E) The NLS fitting of linear (dashed line) and square-root (solid line) functions. (F, G) The relationship between the mean and skewness (F) or kurtosis (G).

