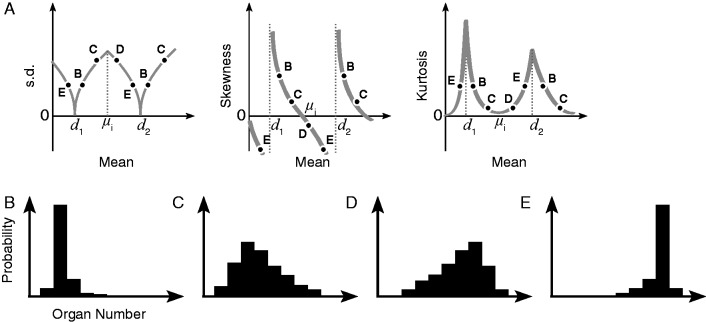
Fig. 4.
Schematic diagram of the changes of statistical quantities between stable modes. (A) In Ranunculus perianth-type variations, the s.d. is close to zero, and the skewness and kurtosis are nearly diverged around the stable modes d1 and d2. Some species have more than one stable mode, and the correlation between the mean and s.d. changes its sign at µi, the x-intersect of skewness. Kurtosis has peaks at the stable modes, reflecting the high stability of these numbers. The letters correspond to the variation curves in B–E. (B–E) The representative shape of variation curves. (B) The curve is steep and right-tailed when the mean of a given population is slightly larger than the stable mode (either d1 or d2). As the mean increases from the stable mode, the curve becomes flattened (lower kurtosis; C) and left-tailed (negative skewness; D). (E) When the mean is slightly smaller than the stable mode, the curve is steep and left-tailed.

