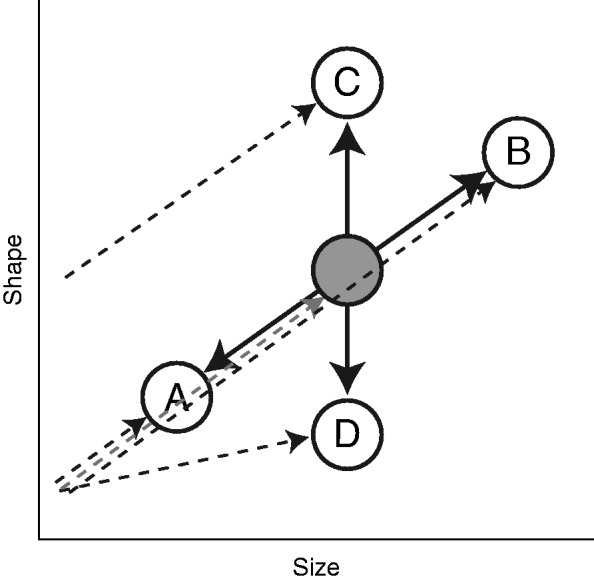
Fig. 1.

Schematic representation of the evolution of a morphological structure following or not following the ontogenetic scaling expectation. The grey circle represents the hypothetical shape–size configuration in the ancestral lineage at a given developmental stage (e.g. the adult). A, B, C and D are shape–size configurations of the same developmental stage in derived species. Thick arrows connecting the ancestral and derived species indicate the direction of the morphological changes shown by each species. Dotted single headed arrows indicate the developmental trajectory leading to the adult stage in each species: ancestral developmental trajectory (grey), derived developmental trajectories (black). Species A and B evolved through ontogenetic scaling (following the ancestral pattern of ontogenetic allometry); species C and D experienced a divergence from the ancestral developmental trajectory.
