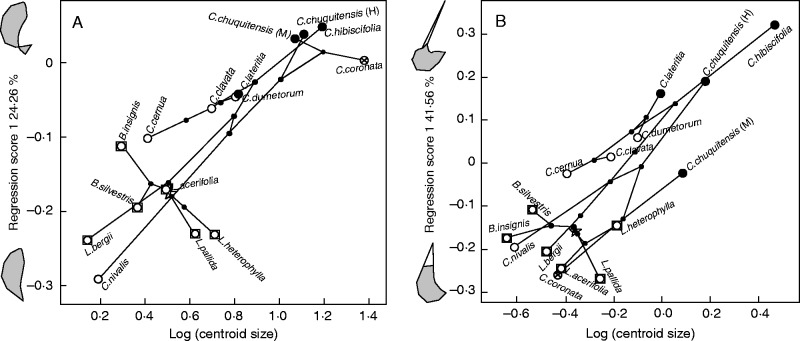
Fig. 4.
Phylomorphospaces describing evolutionary allometry in (A) the petal and (B) the staminodial complex. The percentage of shape variation explained by size is shown along with the shape variants associated with different sizes. The root of the phylogenetic tree is indicated with a star. Basal species are indicated with a square. Pollination strategies are indicated: white = bee pollination, black = hummingbird pollination, strikethrough circle = small rodent pollination.

