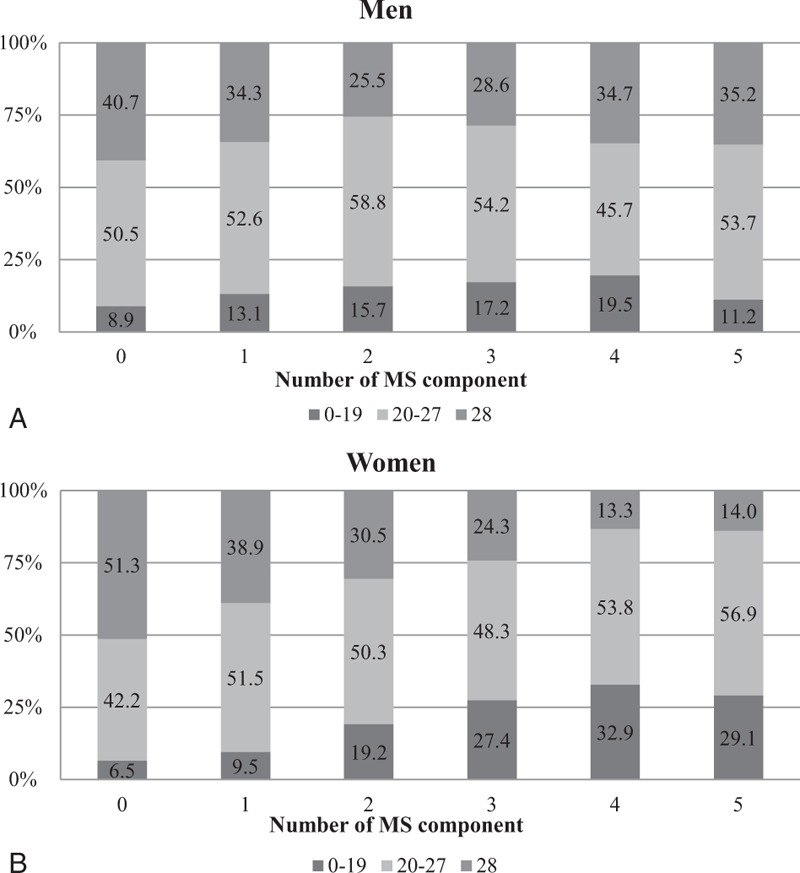
FIGURE 1.

(A) Proportion of each remaining teeth group according to the number of metabolic syndrome (MS) components in men. (P = 0.017, P for trend <0.01). (B) Proportion of each remaining teeth group according to the number of MS components in women (P < 0.001, P for trend <0.001).
