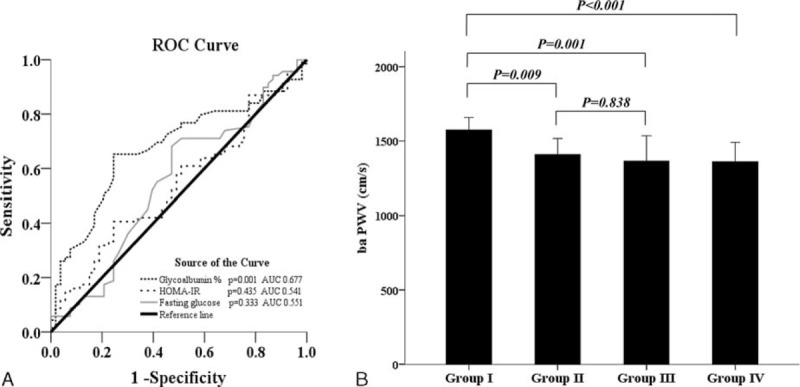
FIGURE 1.

Receiver-operating characteristic (ROC) curve and Brachial–ankle pulse wave velocity in subgroups. ROC curve of each glycemic indices predicting arterial stiffness (A). Brachial–ankle pulse wave velocity in subgroups. Group I: higher glycated albumin (GA) and lower glomerular filtration rate (GFR); Group II: higher GA and higher GFR; Group III: lower GA and lower GFR; Group IV: lower GA and higher GFR (B).
