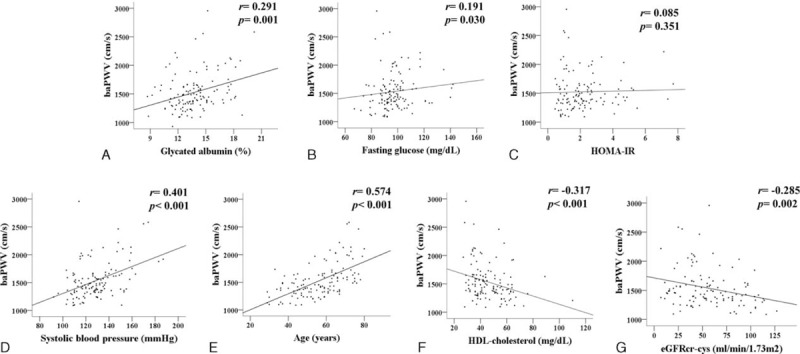
FIGURE 2.

Correlation between brachial–ankle pulse wave velocity and glycated albumin (A), fasting glucose (B), HOMA-IR (C), systolic blood pressure (D), age (E), HDL-cholesterol (F), eGFRcr-cys (G) in the entire subjects. baPWV; brachial–ankle pulse wave velocity, HOMA-IR; The homeostatic model assessment of insulin resistance, HDL: high-density lipoprotein, eGFRcr-cys; estimated GFR measured by serum creatinine and cystatin C. baPWV = brachial-ankle pulse wave velocity, eGFRcr-cys = estimated glomerular filtration rate measured by serum creatinine and cystatin C, HDL = high-density lipoprotein, HOMA-IR = homeostatic model assessment of insulin resistance.
