FIGURE 3.

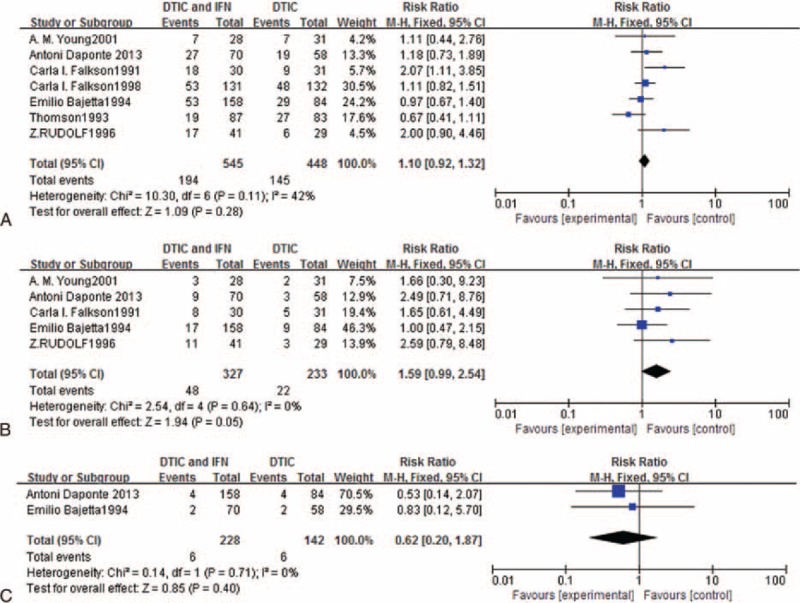
Meta-analysis of the effects of experimental group versus control group in terms of (A) overall response rate, (B) complete response, and (C) partial response.

Meta-analysis of the effects of experimental group versus control group in terms of (A) overall response rate, (B) complete response, and (C) partial response.