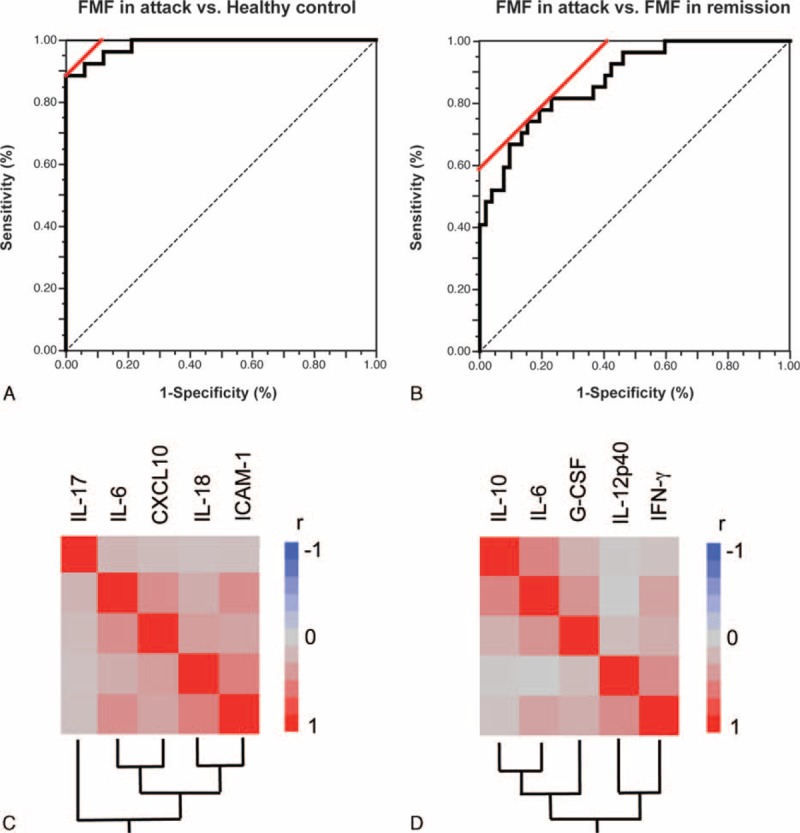
FIGURE 2.

ROC curve analysis for the prediction of FMF in attack by a specific set of cytokines. (A) Healthy control versus FMF in attack; the combined measurement of IL-6, IL-18, and IL-17. (B) FMF in remission versus FMF in attack; the combined measurement of IL-6, G-CSF, IL-12p40, and IL-10. Hierarchical clustering with a Spearman correlation heat map of serum cytokine levels among (C) the FMF in attack and healthy control groups and (D) the FMF in attack and FMF in remission groups. FMF = familial Mediterranean fever, G-CSF = granulocyte colony stimulating factor, IL = interleukin, ROC receiver operator characteristic.
