
FIGURE 3.
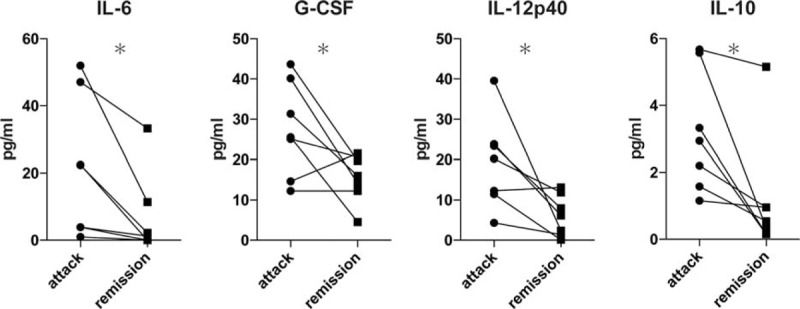
Serial cytokine changes in attack and in remission. The lines link the same patients. The changes from baseline were compared using Wilcoxon signed rank test (∗P < 0.05).
Official websites use .gov
A
.gov website belongs to an official
government organization in the United States.
Secure .gov websites use HTTPS
A lock (
) or https:// means you've safely
connected to the .gov website. Share sensitive
information only on official, secure websites.
Serial cytokine changes in attack and in remission. The lines link the same patients. The changes from baseline were compared using Wilcoxon signed rank test (∗P < 0.05).