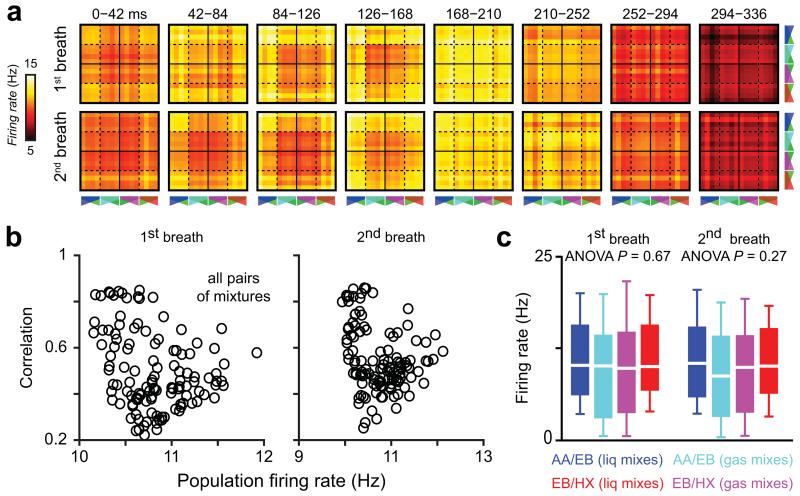
Figure 4.
Population firing rate does not predict output correlations. (a) Temporal evolution of the population firing rate for all possible pairs of mixtures during different breathing cycles after odor onset. Each pixel represents the averaged population firing rate evoked by two mixtures. The organization of the matrices is similar to the one of correlation matrices (see Fig. 2). (b) Output correlation plotted as a function of the population firing rate (averaged over the entire breath) for all possible mixture pairs. Scatter plots for the first two breaths after odor onset are shown. (c) Odor-evoked population firing rate averaged over all cells (n = 78) is not different between subgroups of mixtures. Data are presented as box plots (25th and 75th percentiles) showing the mean in white. Whiskers represent the 10th and 90th percentiles.

