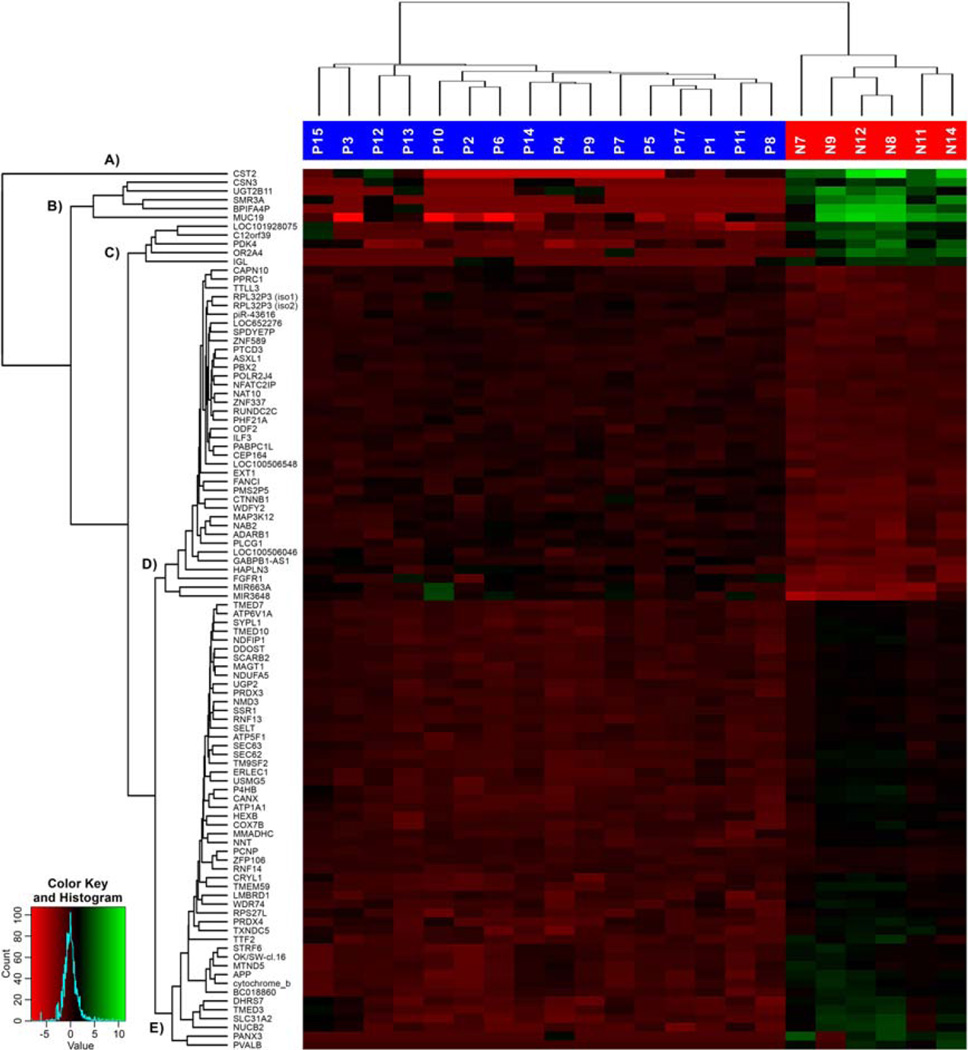
Figure 2.
Heatmap of top 100 highest differentially expressed genes with sample and gene dendrograms, showing five major gene cluster groups labeled A to E. [Color figure can be viewed in the online issue, which is available at wileyonlinelibrary.com.]

