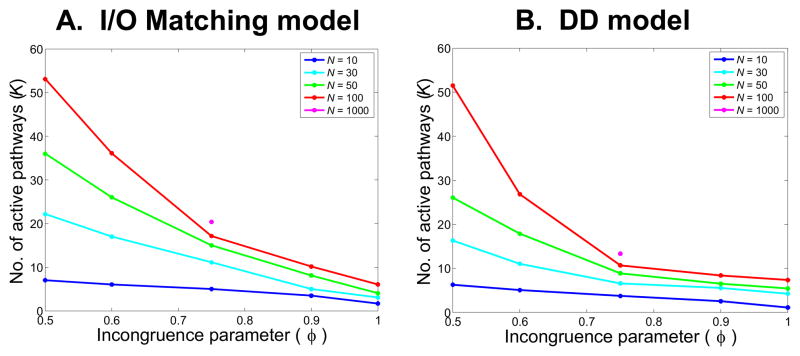
Figure 4. Capacity constraints as a function of incongruence for networks of different sizes.
Plots show the number of pathways active (k>0.5; see text for explanation) under the optimal control policy for different levels of incongruence (φ; along the X-axis) and networks of different sizes (N; different colored lines). All results are for pathway overlap of F = 20% (i.e., F = N/5). Due to the computational demands of our model, we were only able to simulate networks of size 1000 for φ = 0.75, F = 20%). Panel A: I/O Matching model. Note the steeper slope of decline for larger networks, with convergence (at the highest levels of incongruence) to a value of about 10 active pathways, irrespective of network size. Even at φ = 0.75 (the value used for most simulations), the number of pathways that can be simultaneously engaged increases by three for an increase in network size of about 100 (K = 7 for N = 10; K = 23 for N = 1000). Panel B: DD model: These effects are substantially accentuated for the DD model, with near convergence for networks of all sizes at φ = 0.75.

