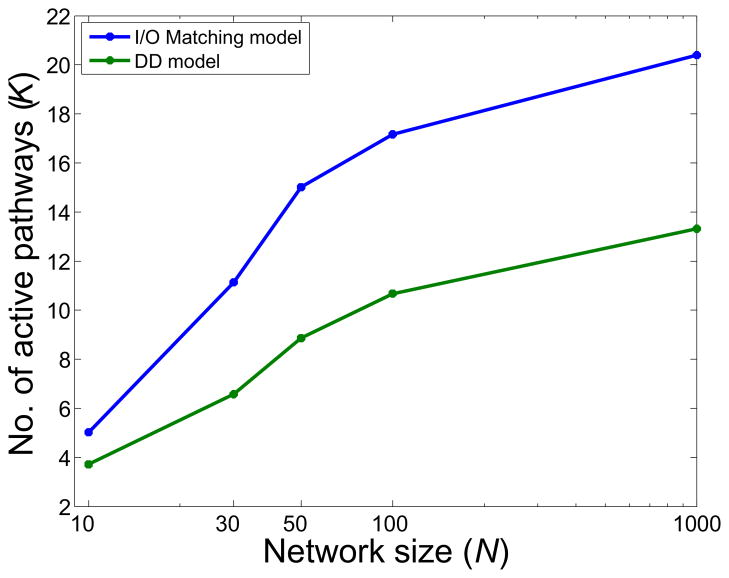
Figure 7. Capacity constraints as a function of network size.
The optimal control policy is plotted for networks of varying size (N = 10 to 1,000) for the I/O Matching (blue) and DD (green) models. Results are for pathway overlap of F = 20% and incongruence of φ = 0.75. Note that the slope of both lines reduces considerably as network size increases, with the slope for the DD model decreasing more quickly and reaching a lower value than the I/O Matching model. See text for discussion. (Note: the change in slope from N = 10 to 30 is due to a disproportionately high number of active connections for small networks — about 50% of the units in the smallest network are active — a small effect that vanishes as N exceeds 30.)

