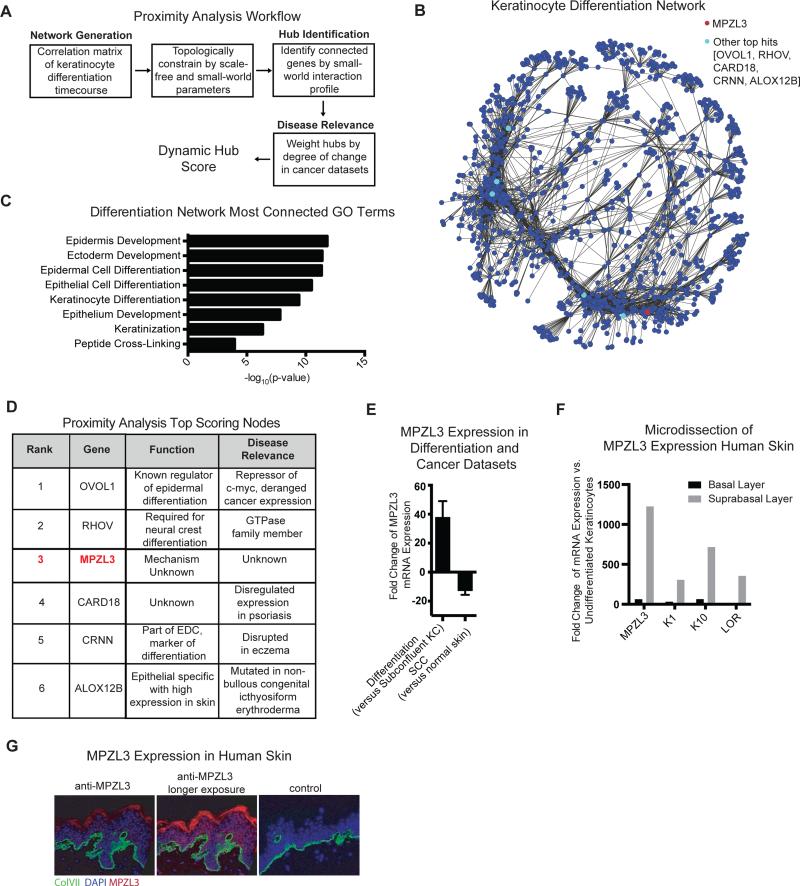
Figure 1. Proximity Analysis Identifies MPZL3 as a Highly Connected Hub in an Epidermal Differentiation Network.
(A) Proximity Analysis workflow consists of a correlation matrix generation that uses topological constraints of scale-free small-world networks to identify genes that are highly connected, and subsequently cutaneous SCC data is used to highlight potential regulators of differentiation. (B) Network depiction of top 10,000 edges from the network. (C) Gene ontology terms for the 500 most connected genes in the differentiation network. (D) Top 6 candidates that emerge from proximity analysis and their characteristics in terms of dynamic hub score, known function and disease relevance. (E) Expression of MPZL3 in differentiation datasets (n = 14) when compared to subconfluent keratinocytes and in cutaneous SCC (n=21) when compared to matched normal skin, mean +/− SD shown. (F) mRNA levels by qPCR from laser capture microscopy separation of basal and suprabasal layers of the skin. (G) Immunofluorescent staining of MPZL3 (red) and collagen VII (green) in normal human skin [left] as well as a no MPZL3 antibody control stained with collagen VII [right]. Bar 15 μM. See also Figures S1 and S2 and Tables S1, S2 and S3.

