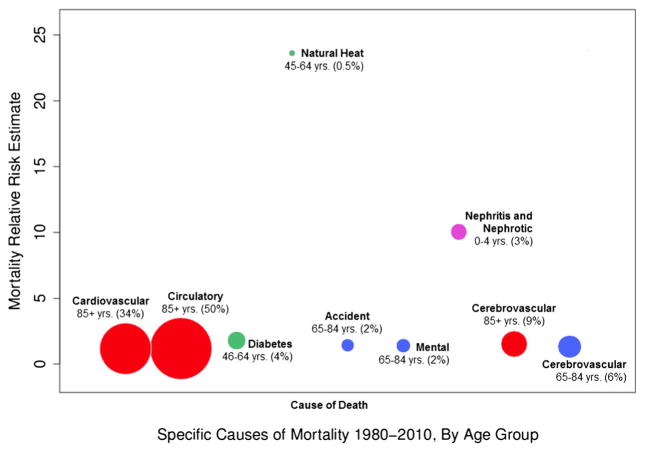
Fig. 2.
Proportional cause-of-death burden in relation to total death, on days designated as heat days, by statistically significant age category; size of bubbles represent proportion of age-adjusted mortality compared with all causes, while placement on the y-axis represents mortality relative risk estimate

