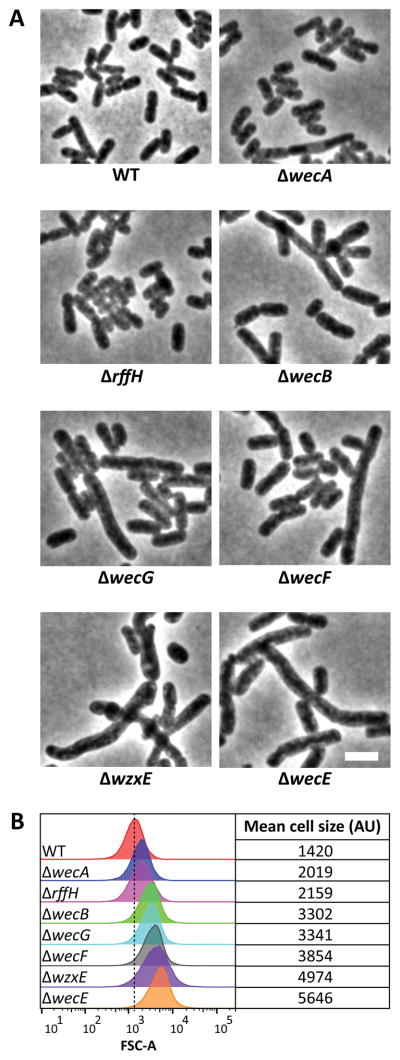
Figure 6. Shape defects of ECA mutants.
(A) Shape. Cells with the indicated genotypes were grown in LB at 37°C to an OD600=0.5–0.6, fixed, and photographed by phase contrast microscopy. (B) Flow cytometry. Histograms of the forward scatter area of live cells shown in panel A. The vertical dashed line represents the mean forward scatter area of the WT. Mean of the forward scatter area is reported in arbitrary units (AU). Flow cytometry data is from 100,000 events (cells). Strains: MAJ3 (WT), MAJ73 (ΔwecE), MAJ101 (ΔwecA), MAJ102 (ΔwecB), MAJ103 (ΔwecF), MAJ104 (ΔwzxE), MAJ118 (ΔrffH), and MAJ119 (ΔwecG).

