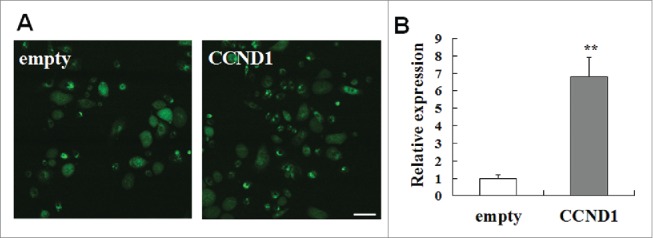
Figure 1.

Cell transfection and the expression of pEGFP-N1-CCND1. A: Cell transfection of pEGFP-N1-CCND1. Scale bar = 50 μm. B: The expression of CCND1 detected by quantitative real-time PCR. The CT data of empty group (control) were seen as “1” and the relative expression of the other group was calculated according to the empty group by the CT data. The data are the means ± SD (n = 10). **P < 0.01, as compared with empty vector control. CCND1, cyclin D1; EGFP, enhanced green fluorescent protein; SD, standard deviation.
