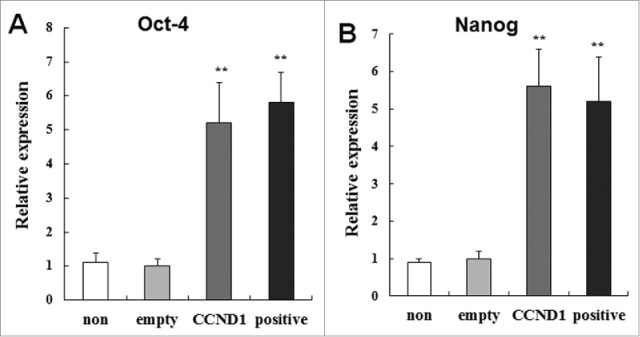
Figure 4.

Relative expression of self-renewal and pluripotency genes Oct4 and Nanog in the 4 groups. A: Relative expression of Oct4; B: Relative expression of Nanog. The data are the means ± SD (n = 10). **P < 0.01, as compared with empty vector control. CCND1, cyclin D1; G, group; SD, standard deviation.
