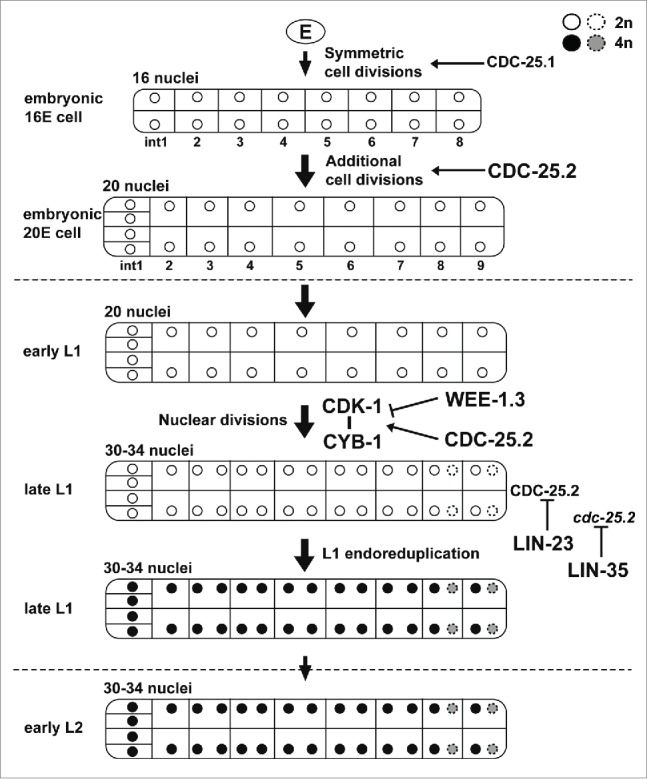
Figure 6.

A proposed model for the function and regulation of CDC-25.2 during C. elegans intestinal development. Tubes and internal compartments indicate the whole intestine and intestinal cells, respectively. Circles indicate intestinal nuclei and the gray scale indicates different DNA contents of the nuclei after endoreduplications (white, 2n; black and gray, 4n). Broken circles indicate intestinal nuclei that occasionally divided during nuclear divisions. Vertical arrows indicate the progression of intestinal divisions. Broken horizontal lines indicate the borders of developmental stages. Horizontal arrows indicate that respective intestinal divisions are positively regulated by CDC-25.1 or CDC-25.2. The horizontal T-bar indicates the inhibition of the CDK-1/CYB-1 complex by WEE-1.3. The vertical T-bars indicate the inhibition of CDC-25.2 protein and cdc-25.2 mRNA by LIN-23 and LIN-35, respectively.
