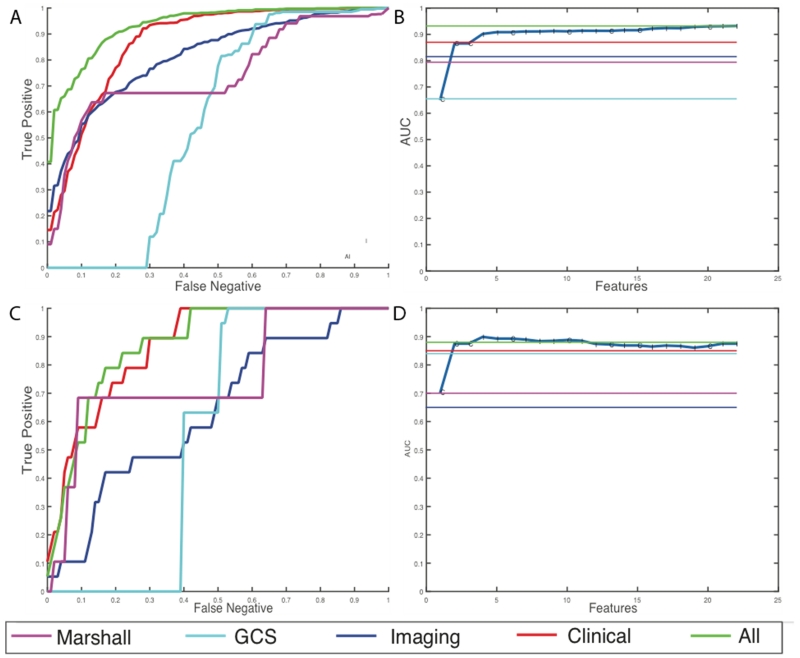
Figure 5.
Results for prediction of high-risk discharge GCS cases (a) Average ROC curves internal cross-validated sets (b) Average effect of each new feature that is added via the greedy feature selection method (c) ROC curve for the holdout dataset (d) Effect of each new feature that is added via the greedy feature selection method in the holdout dataset.

