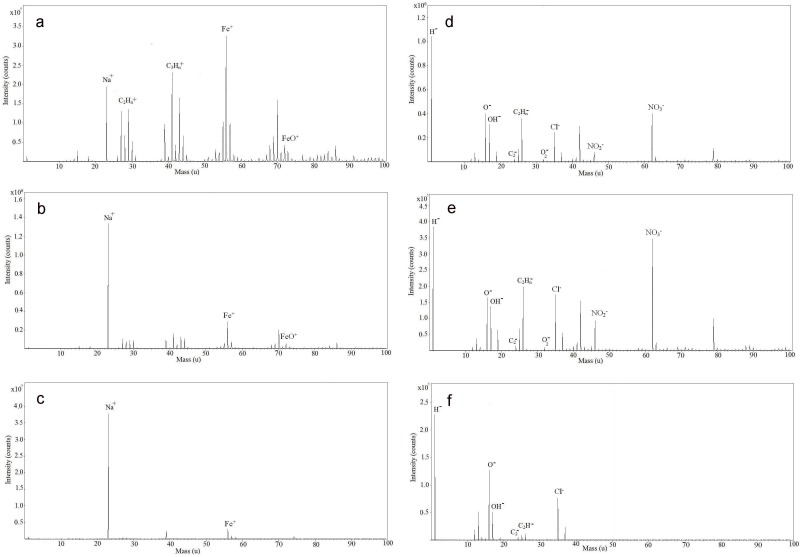
Fig 6.
Positive TOF-SIMS spectra of (a) bare, (b) positively charged and (c) negatively charged SPIONs; negative TOF-SIMS spectra of (d) bare, (e) positively charged and (f) negatively charged SPIONs after incubation with the biofilm. The intensity of each peak was different for each sample. The intensity peak ratios changed from one sample to the others.

