
Fig 7.
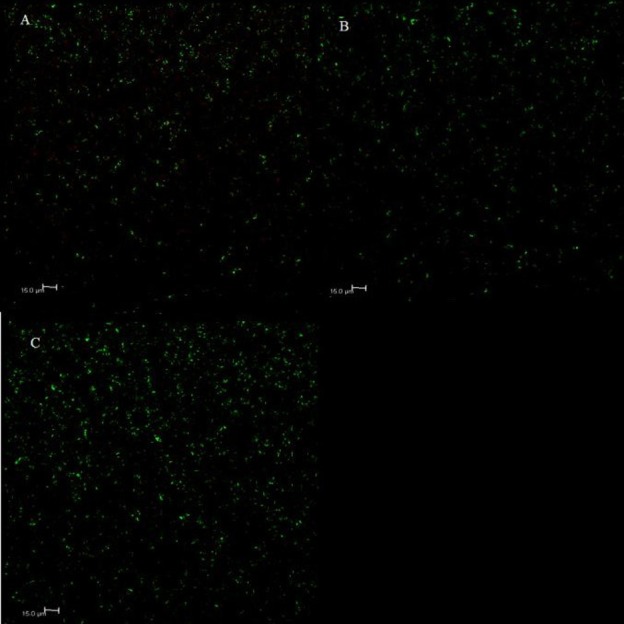
Representative images of the bactericidal effect of (A) bare, (B) positively charged and (C) negatively charged SPIONs on the S. mutans biofilm for a SPION concentration of 2 μg mL-1. Images for exposures to 1 μg mL-1 and 3 μg mL-1 can be found in S2 and S3 Figs. For each image, green coloration indicates live cells while red coloration indicates dead cells.