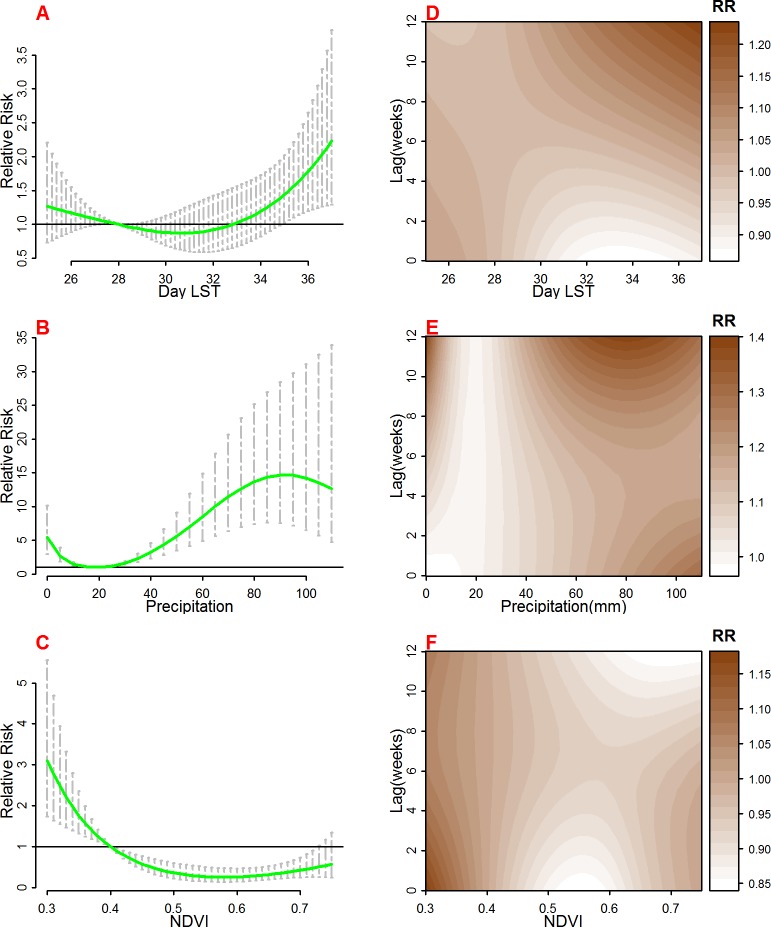
Fig 3.
The overall risk of day Land Surface Temperature (LST °C) (A), Precipitation (mm) (B), and Normalized Difference Vegetation Index (NDVI) (C) on malaria mortality for all areas for the whole lag period. The bold lines indicate relative risks while the shaded regions display the 95% Confidence intervals. D, E and F are the lag patterns for day LST, precipitation and NDVI respectively at whole range of predictors.

