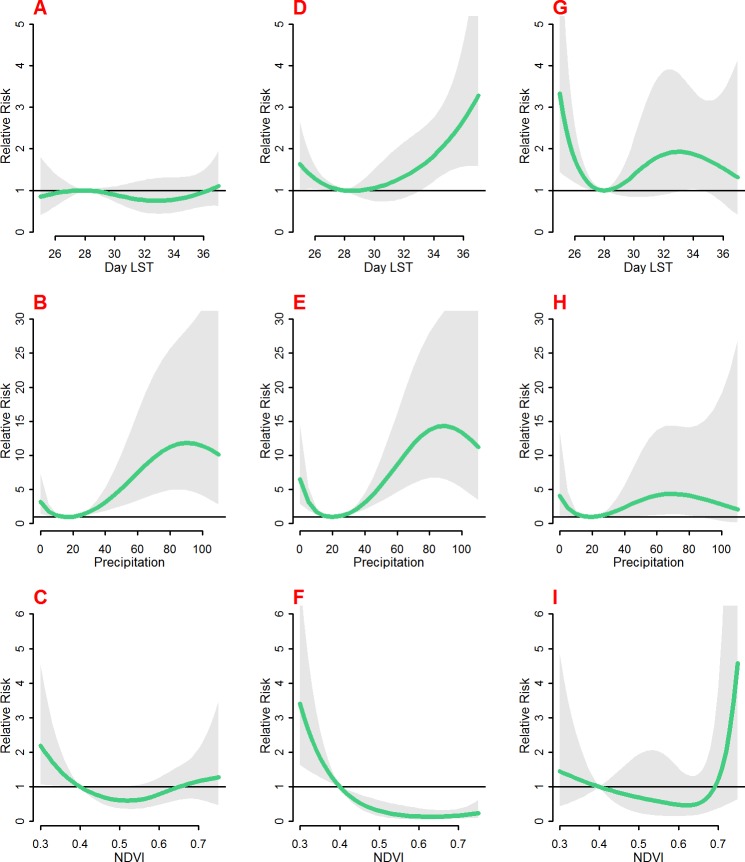
Fig 4.
The overall risk of day LST (°C) (A, D and G), Precipitation (mm) (B, E and H), and NDVI (C, F and I) on malaria mortality in Asembo (A, B and C), Gem (D, E and F) and Karemo (G, H and I) for the whole lag period. The bold lines indicate relative risks while the shaded regions display the 95% Confidence intervals.

