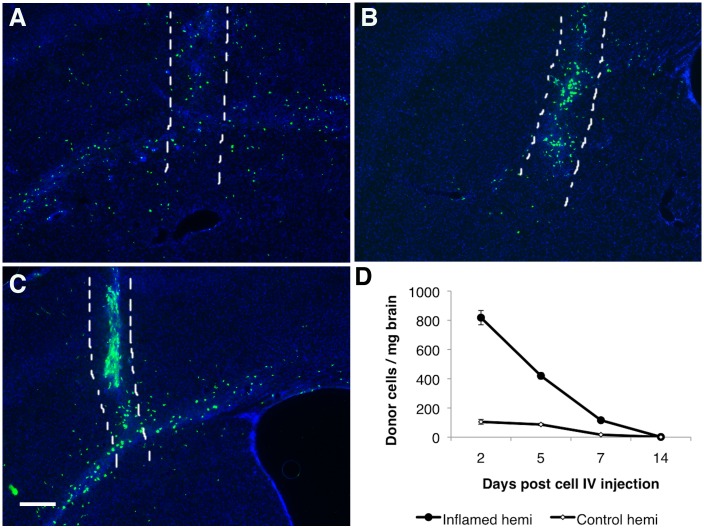
Fig 2. IV transferred monocytes ingression in brain.
(A-C) Representative sections show the distribution of GFP positive donor-derived monocytes in the LPS injected brain at day 2(A), day 5(B), and day 7(C) post monocytes IV transfer. The area between the two white dash lines indicated the physical needle insertion site. For panel A-C, bar represent 200 μm, original magnification ×40. (D) Number of donor cells detected in the LPS injected hemisphere (ipsi hemi = ipsilateral hemi) and in the other hemisphere (contral hemi = contralateral) decreased over time post monocyte IV transfer.

