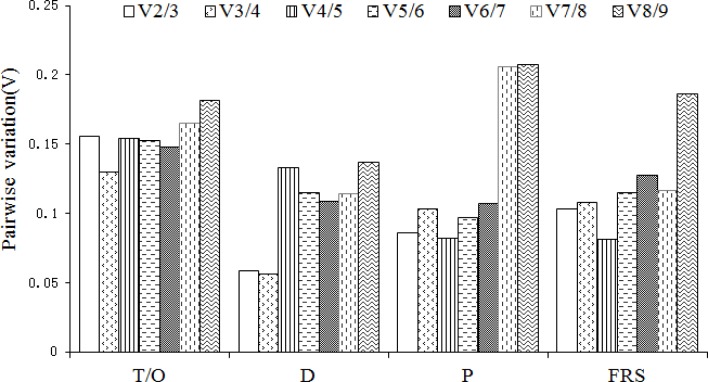
Fig 3. Pairwise variation (V) calculated by geNorm to determine the optimal number of reference genes.
The average pairwise variations Vn/Vn+1 was analyzed between the normalization factors NFn and NFn+1 to indicate the optimal number of reference genes required for RT-qPCR data normalization in different samples. T/O: Different tissue/organs, D: Dark conditions, P: Phytoplasma infection, FRS: Fruit ripening stages.

