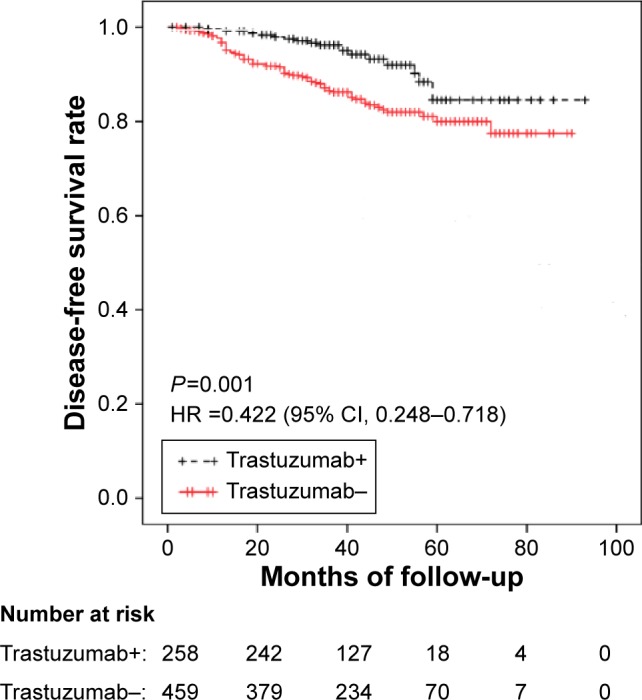
Figure 2.

DFS of the patients according to treatment with trastuzumab.
Note: Patients who received both trastuzumab and chemotherapy (trastuzumab+ group) exhibited a longer DFS than those who received chemotherapy alone (trastuzumab− group) (P=0.001) (95% CI: 0.248–0.718; HR: 0.422).
Abbreviations: DFS, disease-free survival; HR, hazard ratio; CI, confidence interval.
