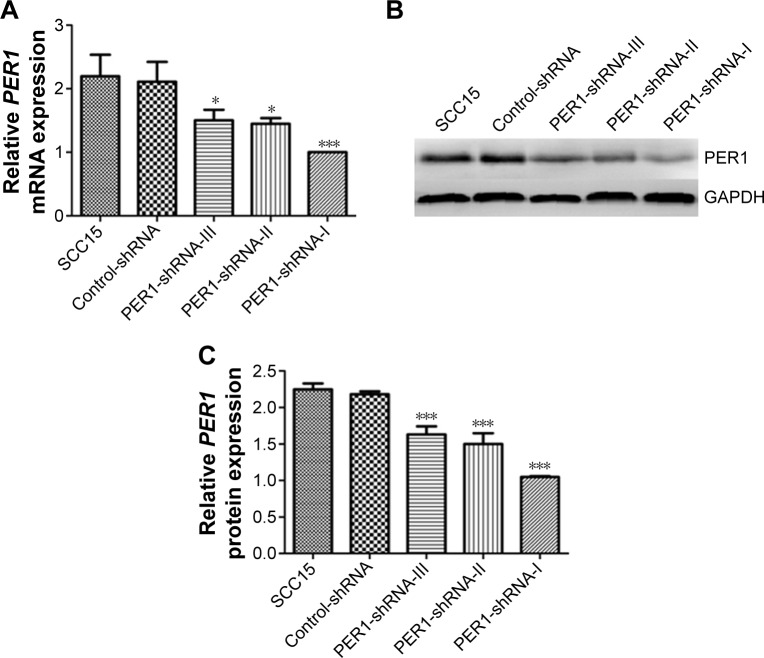
Figure 1.
PER1 mRNA and protein expression in SCC15 cells.
Notes: (A) PER1 mRNA expression levels were determined by quantitative real-time PCR. (B) Representative PER1 protein expression was determined by Western blot analysis, and (C) the band density values were calculated as a ratio to GAPDH. ***P<0.0001 and *P<0.05 compared to control cells. The data are presented as the mean ± SD, and the results were analyzed by one-way ANOVA with pairwise comparisons, followed by the LSD-t.
Abbreviations: PCR, polymerase chain reaction; SD, standard deviation; ANOVA, analysis of variance; LSD-t, least significant difference test; shRNA, short hairpin RNA; GAPDH, glyceraldehyde-3-phosphate dehydrogenase.

