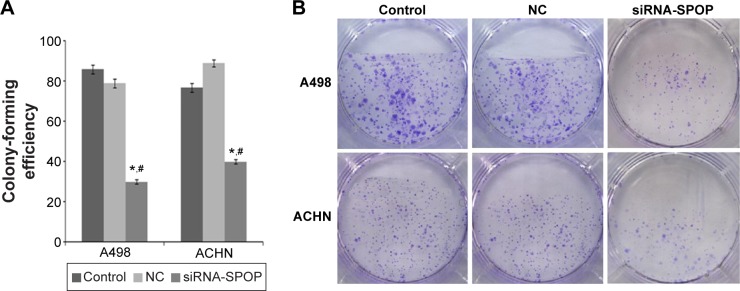
Figure 3.
The effects of SPOP silencing on the colony formation of the A498 and ACHN cells.
Notes: (A) Quantitative data analysis of the effects of SPOP silencing on the colony formation of the cells. (B) Representative images of the colony formation of the cells. *P<0.05 vs control and #P<0.05 vs NC.
Abbreviations: SPOP, speckle-type POZ protein; NC, negative control; siRNA, small interference RNA.

