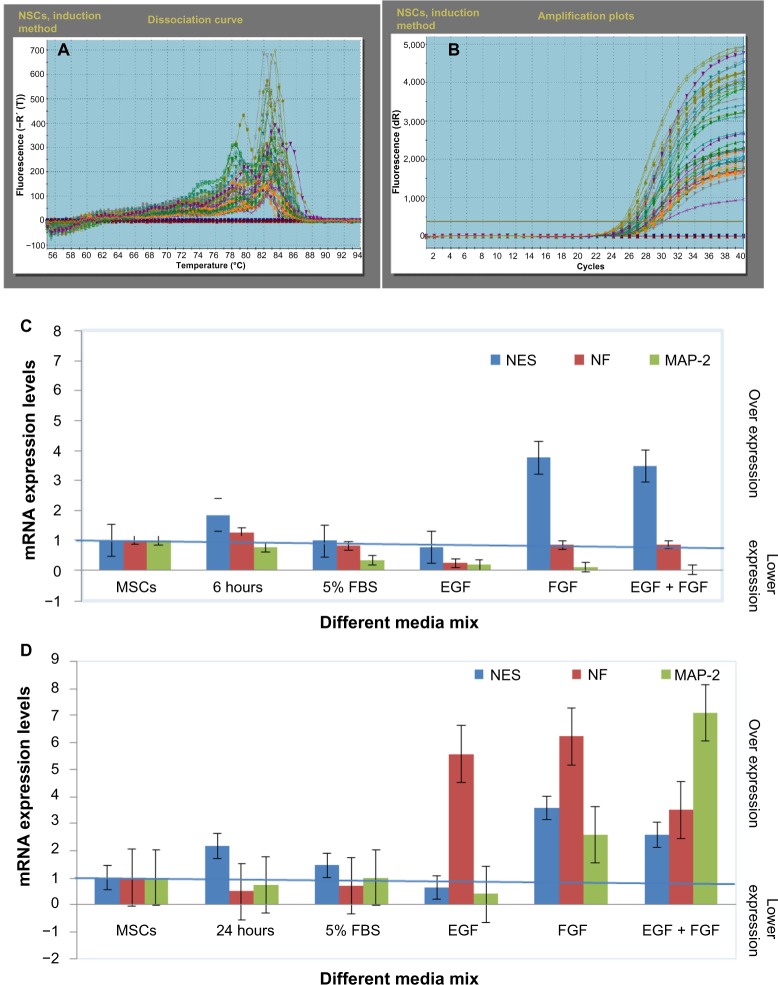
Figure 12.
RT-PCR analysis of NES, NF-L, and MAP-2 genes in NSCs using BME, which indicated the stability of the NES gene in all the different culturing media formulas and the instability of each NF-L and MAP-2 genes compared with the 24 hours exposure (the production stage of NSCs).
Notes: GAPDH was used as control (housekeeping gene). (A) Amplification plot of all primers, (B) dissociation curve of all primers, (C and D) results of RT-PCR for 6 and 24 hours, respectively. Note that these data were significant at P<0.05 and represent the ∆CT of mean ± seM.
Abbreviations: RT-PCR, real time-PCR; NES, nestin; NF-L, neurofilament light; MAP-2, microtubule-associated protein 2; NSCs, neural stem cells; BME, β-mercaptoethanol; SEM, standard error of mean; EGF, epidermal growth factor; FGF, fibroblast growth factor; MSCs, mesenchymal stem cells.

