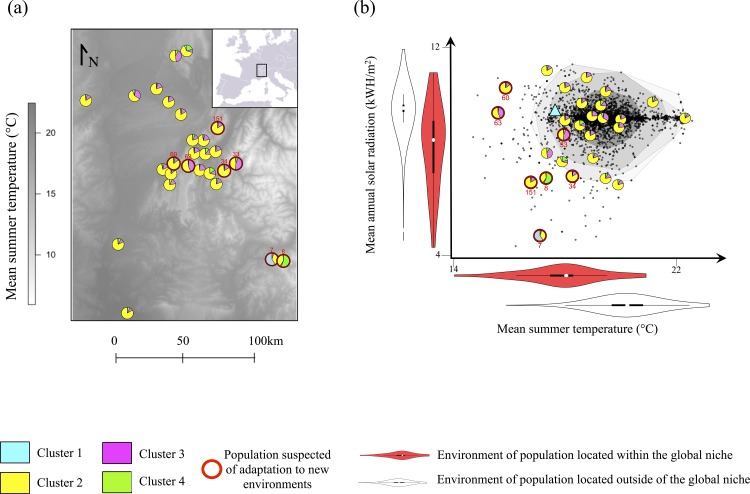
Fig 1. Location of the 27 populations sampled for the genetic analysis.
Populations are presented in (a) the geographic space, plotted over a map of the mean summer temperature and (b) the regional niche space. Each population is represented with a pie chart showing the average proportion of the genetic clusters inferred from structure in each population. The populations a priori suspected of adaptation to novel climates are circled in red. For (b) the dark grey dots indicate the position of the 3,888 populations of A. artemisiifolia recorded in the French Alps, used to estimate the regional niche of the species. A blue triangle represents the location of the common garden experiment.

