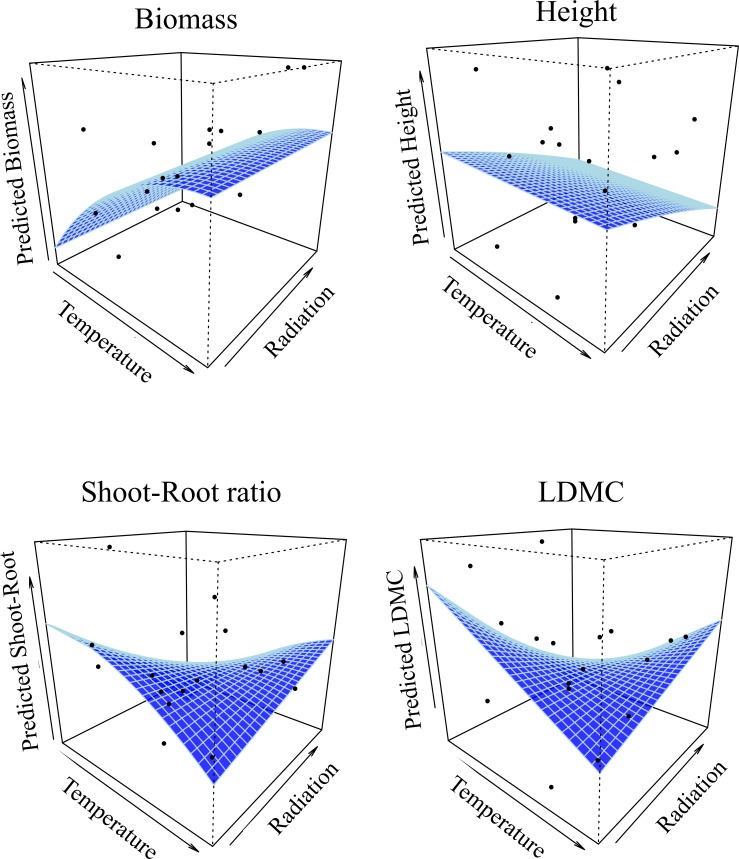
Fig 3. Relationship between each of the four functional traits measured in common garden and the two axes of regional niche gradients.
The two environmental gradients are mean summer temperature and mean annual solar radiation. Curves were estimated from generalized mixed effect models taking into account the population structure and the experimental design random effects. The black dots represent the mean trait value for each population.

