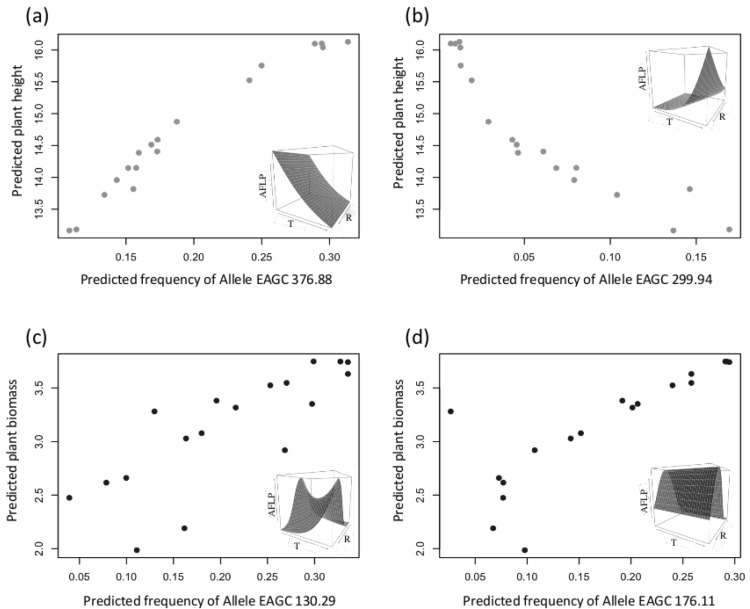
Fig 5. Four examples of strong correlations between estimated population AFLP marker frequency and estimated population functional trait value (correlation coefficient > 0.8).
The first line (a-b) shows two correlations between the population predicted allelic frequency with the predicted plant height, and the second line (c-d) shows two correlations with the predicted plant biomass. In the upper right corner of the four graphics is represented the allele environment relationship (T: temperature, R: radiation).

