
Figure 2.
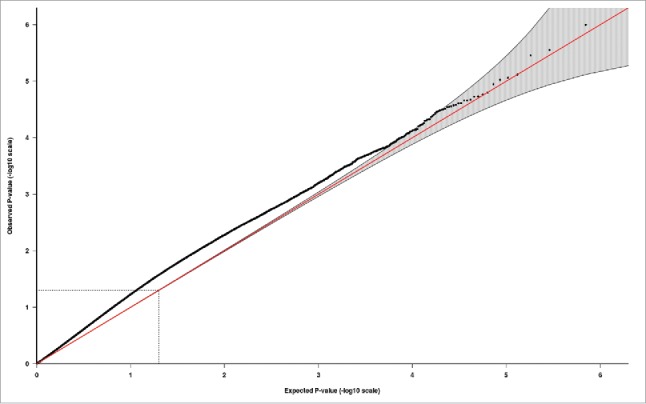
Quantile-quantile (QQ) plot illustrating probability values from the EWAS meta-analysis of the PMSE score in cord blood (ntotal = 1,740). The red line indicates the distribution under the null hypothesis and the shaded area indicates the 95% confidence band.