Figure 6.

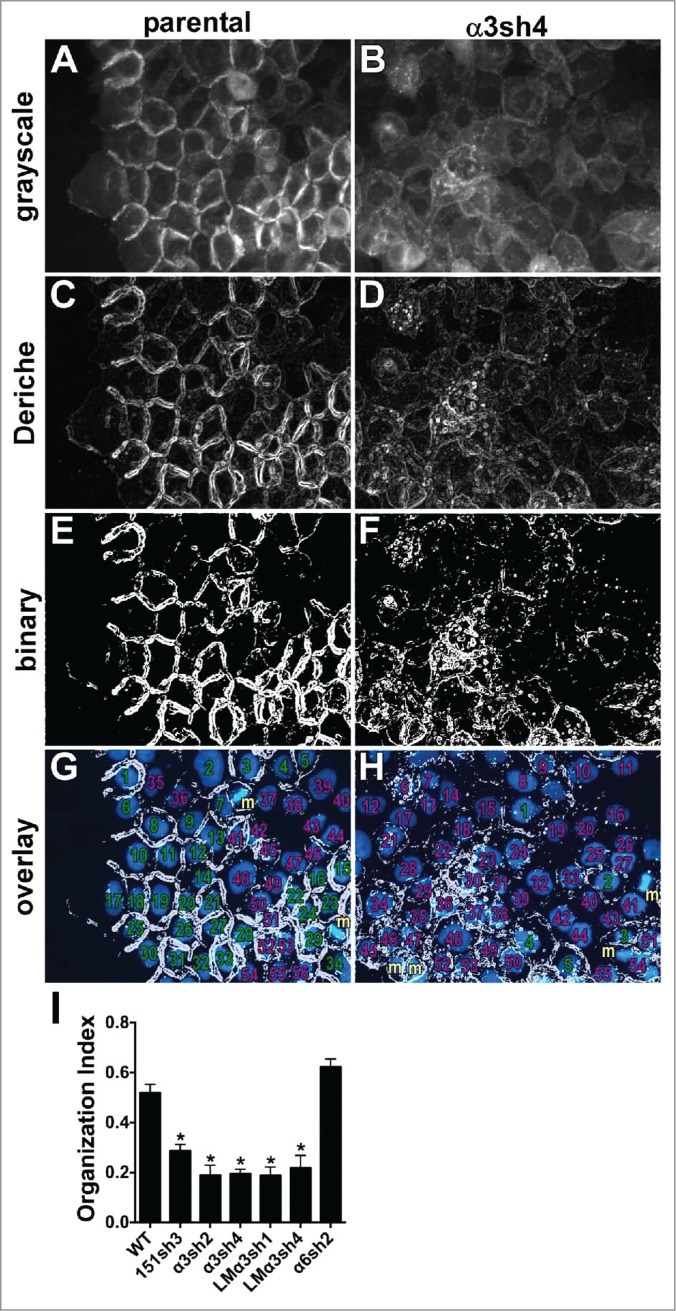
Quantitative analysis of junctional organization. Junctional organization was quantified as described in Experimental Procedures. Representative fields from parental and α3-silenced A431 cells are shown. (A&B) original grayscale images; (C&D) images after Canny-Deriche edge detection filtering; (E&F) edge detection image converted to binary image; (G&H) binary image overlaid with DAPI-stained nuclei (blue). Cells scored as having ≥ 2 organized junctions are numbered in green; those with fewer than 2 organized junctions are numbered in magenta. Cells not included because they were undergoing mitosis at time of fixation are labeled with “m” in gold. (I) The proportion of cells with ≥ 2 organized junctions/cell was quantified for 8 separate fields per cell type is graphed as mean with SEM. CD151-silenced, α3 integrin-silenced, and laminin-α3-silenced cells all showed significantly reduced junctional organization compared to WT parental or α6 integrin-silenced cells, *P ≤ 0.0005 (ANOVA with Tukey post tests).
